
Cycles: Finish
|
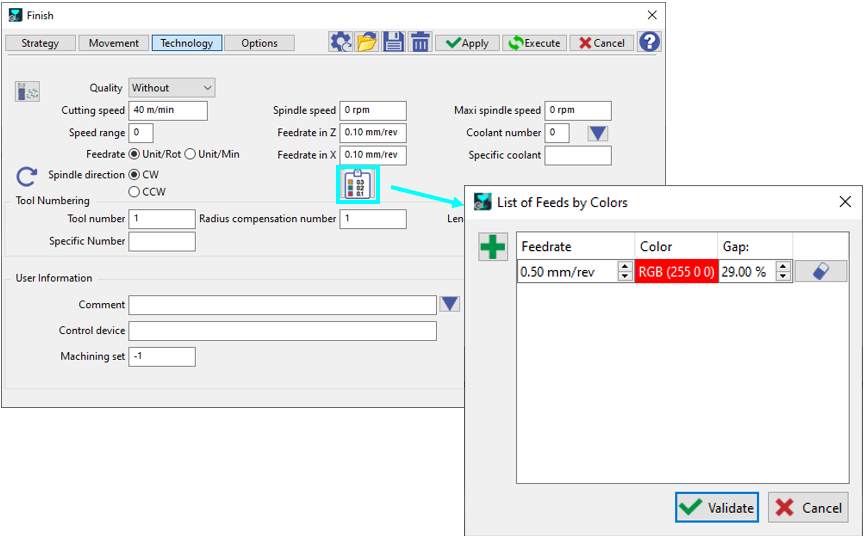
This option facilitates the creation of a table that associates feedrates with specific colors. During cycle execution, the necessary techno-functions to adjust the feedrate are automatically generated. It allows for the programming of a single toolpath across an entire shape, incorporating multiple feedrate changes seamlessly.
It does not work if some local stock allowances are defined on the profile. |
|
|
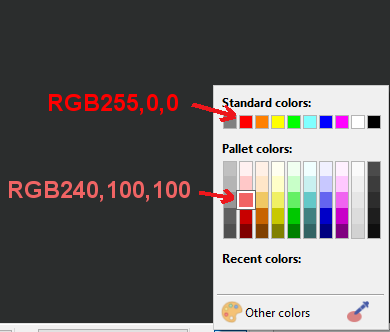
In the table, the feedrate does correspond to a color, with a tolerance of color recognition. Each color is a combination of 3 colors, Red, Green and Blue, this is waht we call RGB. To match colors, the principle is to compute the sum of the 3 differences and divide by 3 to get the percent. More information about RGB color system: https://en.wikipedia.org/wiki/RGB_color_model
|
|

|
|