

|
Once you have mounted all tools in their designated positions in your CNC machine, this control menu allows you to simulate the entire machining process virtually, identifying and rectifying potential errors within the code. By essentially running the program without engaging the machine itself, you can guarantee efficient and accurate operation from the very first cut. |
Machine tab
|
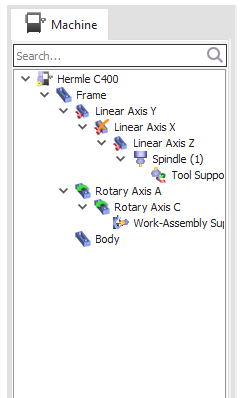
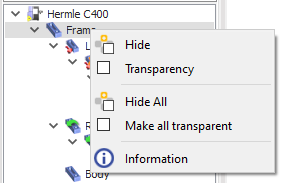
This tab provides a comprehensive view of all the defined components that make up this machine. Each component is represented visually, giving you a clear understanding of the machine's structure. By right-clicking on any component, you'll access a context menu offering several options:
Hide/Unhide: Scroll wheel click a component to hide or unhide it. |
|
|
|
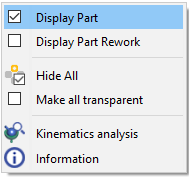
Right-clicking in the control environment opens a pop-up menu with these options: |
|
|
|
Gantt Chart
This horizontal timeline utilizes color coding to differentiate between various cycles and their respective durations. It offers a clear and concise overview of the simulation's progress.

|
In Turning and Swiss machining, the Gantt chart graphics have been renewed. It can be moved and it is resizable! |
|

|
||
|
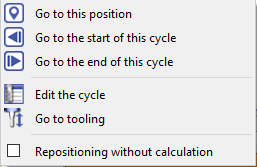
The Gantt chart has a right-click menu that empowers you with fine-tuned control over the simulation: |
|
|
|
Cycle Navigation: Effortlessly jump to specific points within a cycle, such as the beginning, end, or a particular user-defined position. This allows for focused examination of critical moments. |
||
|
Cycle Editing & Management: Modify specific cycles directly, adjust tooling options as needed, and trigger recalculations for fine-tuning your simulation. |
||
|
Control Flow Management: Strategically set breakpoints to pause the simulation at predetermined points in time. This facilitates in-depth analysis and troubleshooting. |

|
|
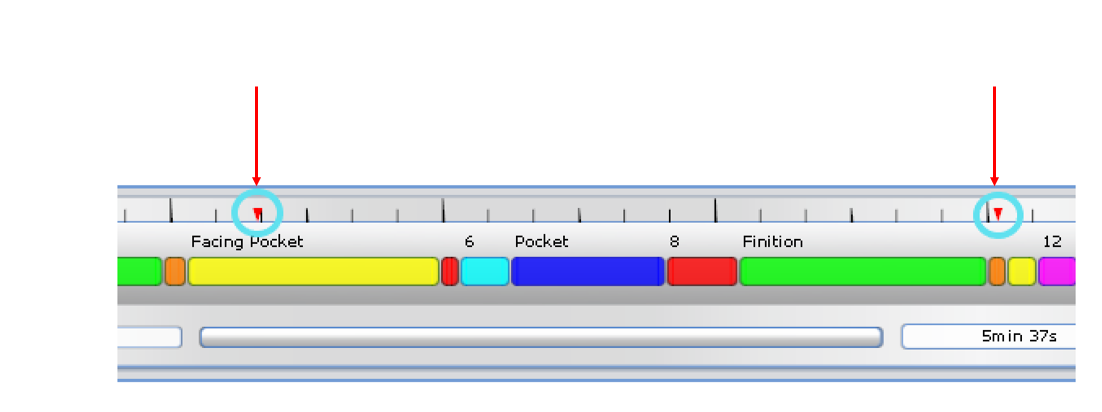
Collision Management Collisions are indicated in orange when axis limits are exceeded. The specific components involved in the collision are also highlighted in orange. |
|
|
|
|
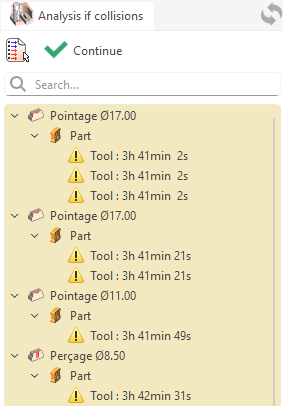
Collision Tree The tree has been reimplemented in Qt, now supports search, and correctly respects the selected units instead of always displaying values in millimeters. |
|
|
Breakpoints can now be enabled or disabled directly from the popup window. An active breakpoint (in red) will pause execution, while a disabled breakpoint (in green) will allow it to continue. This action can be performed from the Gantt chart or the NC program. |

|
|
Tool change points are now visible and display tips in MTE simulation. |
Coordinates Dialog
|
|
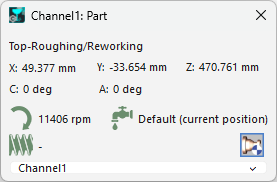
Coordinates Window The part and machine origins are changeable with the button on the bottom right. Tooltips are available on icons and buttons. All icons are matched for dark mode, and the rotation icon now clearly indicates whether it affects the stock, the tool, or neither. |
|
NC Code Tab
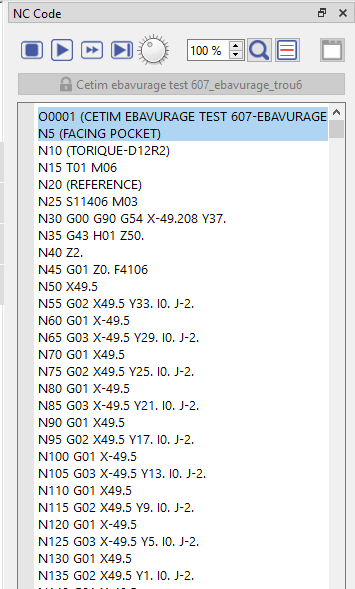
This tab displays the detailed instructions that govern the simulation's behavior, providing a deeper understanding of the underlying processes.
|
|
|
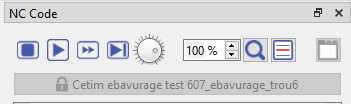
These controls allow you to control the simulation of the NC code and to view the NC code in more detail:
|
|
|
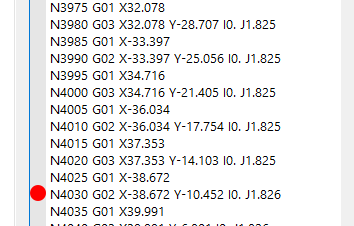
In the NC code window, breakpoints can be inserted directly in the editor by clicking on the left banner next to the desired line and a red dot will appear.
|
|
The Comparison tool is available directly within the Machine Tool Environment (MTE). Under Machine and Control, you can toggle between Remaining Material and Tolerance Range to check for excess stock or deviations alongside your full machine setup—making it easier to adjust toolpaths for a flawless surface finish before cutting. The video below demonstrates this new workflow.